

An SLA wind–tunnel scale model is only worth bolting to the balance ifit measures your design and not your printer. That depends on the outer mold line (OML), the surface texture, the edges, and the stiffness all holding at test conditions.
I have stood behind a tunnel crew while an overtime hour at $990 ticked away because a model arrived warped, rough, or with a blocked tap. Nobody budgets for that hour and nobody gets it back. This guide covers the physics behind those failures and the controls we apply at 3D Vector. Our industrial SLA service delivers scale models in 1 to 3 days with sub–2 µm Ra surfaces and verified OML fidelity, which gives backlogged OEM labs and race teams an overflow buffer they can schedule against.
Why does surface roughness corrupt wind-tunnel data on a printed model?
Roughness corrupts tunnel data because it can push boundary–layer transition upstream of where the full–size car would see it. Once transition moves, drag, separation behavior, and wake structure change for reasons that have nothing to do with your geometry revision.
A scale model runs at a lower Reynolds number than the vehicle, so laminar flow survives farther along many surfaces. That makes the model more sensitive to finish, not less. A swept–wing tunnel study showed distributed roughness moving transition upstream, and a 2025 study measured a laminar separation bubble shortened by about 9.2 percent as roughness accelerated transition. Another 2025 study of a post–processed printed aircraft model reported lower drag and steadier flow after precision surface treatment. If you have ever burned a tunnel day at $595 to $990 per hour on a drag number you could not explain, you already know where the next suspect is.
How does a 10-micron stair-step ridge interact with a 0.25 mm boundary layer?
A lone 10 micron ridge sits deep inside a 0.25 mm laminar boundary layer and barely disturbs it, but a printed surface rarely offers a lone ridge. The risk climbs steeply with ridge height, which is why the finish specification matters.
Take a flat–plate estimate at 40 m/s in air, with a kinematic viscosity of 15 square millimeters per second. A laminar boundary layer reaches 0.25 mm thick about 6.7 mm behind a leading edge. That is a nose, a splitter lip, or the front ofa wing element, which is exactly where transition gets decided. Close to the wall the velocity profile is nearly a straight line. At height y the local speed is about 0.33 times the free–stream speed times y divided by 50 micrometers, and 50 micrometers is the length scale for this case.
A 10 micron ridge therefore sees a local speed near 2.7 m/s. That ridge is only 4 percent of the layer thickness and it sits in the slowest part of the profile, where the air barely moves. Height alone cannot make it a trip. The roughness Reynolds number, built from that speed, the ridge height, and the viscosity, comes out near 2. Isolated roughness elements usually need values in the few hundreds to trip a laminar layer, so a single 10 micron step is hydrodynamically quiet. Now grow the ridge. At 50 microns the local speed reaches about 13 m/s and the roughness Reynolds number is roughly 44. At 100 microns it is near 170. At
150 microns it passes 330. Height rises fifteen times and the number rises about 190 times, because the speed at the crest and the height itself grow together.
That is the whole argument for a surface specification. A sub–2 µm Ra surface keeps peak–to–valley roughness near the 10 micron end of that curve. Unfinished layer steps, sanding waves, primer orange peel, and bond seams live at 50 to 150 microns, where you are marching toward the threshold. A layer line also runs across the flow, so it behaves like a two–dimensional wire, and wires tend to trip a layer at lower values than an isolated bump. Adverse pressure gradients behind a suction peak make things worse, because the layer becomes far more receptive to disturbances and a ridge that looks safe in a flat–plate estimate can still seed the instability that sets bubble length. Use these numbers to rank defects, not to predict the tunnel. They tell you which ones to chase first.
Why do Ra and Rz both belong on the specification?
Ra reports average roughness while Rz captures the tallest peak and deepest valley across the sample length. Tripping is driven by peaks, so a surface with sub–2 µm Ra can still hide a single tall defect that Ra never shows.
We hold aero–critical zones to sub–2 µm Ra as delivered and suggest an Rz limit and a waviness limit alongside it. Name the zones that must not be blended, the direction finishing marks may run, and where witness lines are acceptable. A uniform surface can be handled in correlation work. A surface that varies around the leading edge or between revisions cannot, because you no longer know whether a force delta came from your change or from the process.
What edge and feature fidelity does a 1:5 aerodynamic model require?
The model must reproduce trailing–edge thickness, edge radius, and gaps at a size where the printer‘s minimum feature is a real fraction of the part. A rounded edge or an overfilled gap shifts separation and pressure recovery even when the overall OML looks right.
Scaling is unforgiving. A 0.20 inch trailing edge at full scale becomes 0.01 inch on a 5 percent model, which is about 0.25 mm. NASA high–lift model guidance asks for leading–edge tolerances as tight as plus or minus 0.0015 inch. The same logic applies to gurney flaps, strake edges, diffuser exits, canards, and panel gaps on a car. A 2024 Sauber technical presentation warns that millimeter–scale gaps and forward–facing steps can cause unintended separation or flow spillage. Instrumentation raises the bar again, since balance interfaces, datum features, and removable panels all have to land in position relative to the OML. Learning at installation that a lip is blunt means paying for the changeover at up to $990 an hour to find out.
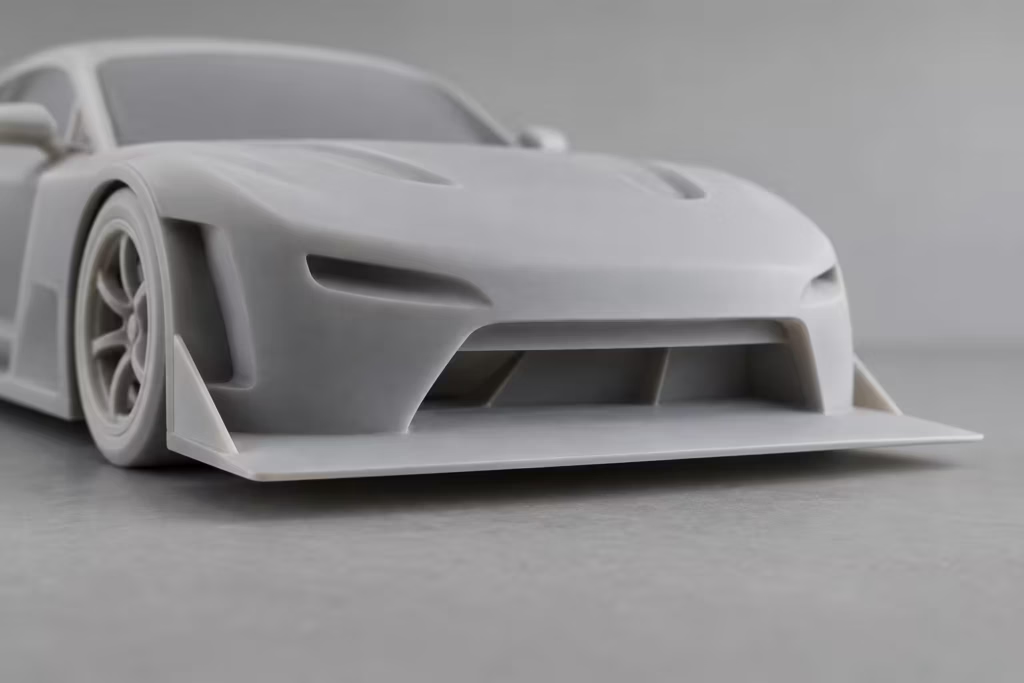
Trailing-edge and splitter lip close-up
How thin can a trailing edge or splitter lip be and still survive finishing?
The limit comes from resin, build orientation, and what survives support removal, so the honest answer is a measured value on the delivered part. Ask for trailing–edge thickness and edge radius as inspection items and not only as design intent.
We orient parts so supports and stair–stepping land away from edges and sensitive surfaces. Split lines go where a seam cannot sit in attached flow. Protected geometry does not get hand sanding, because a splitter lip rolled by an operator is a different splitter lip. The smooth as–printed surface of industrial SLA is what lets us skip that step on the zones that matter most.
Can SLA hold 0.6 mm internal pressure taps?
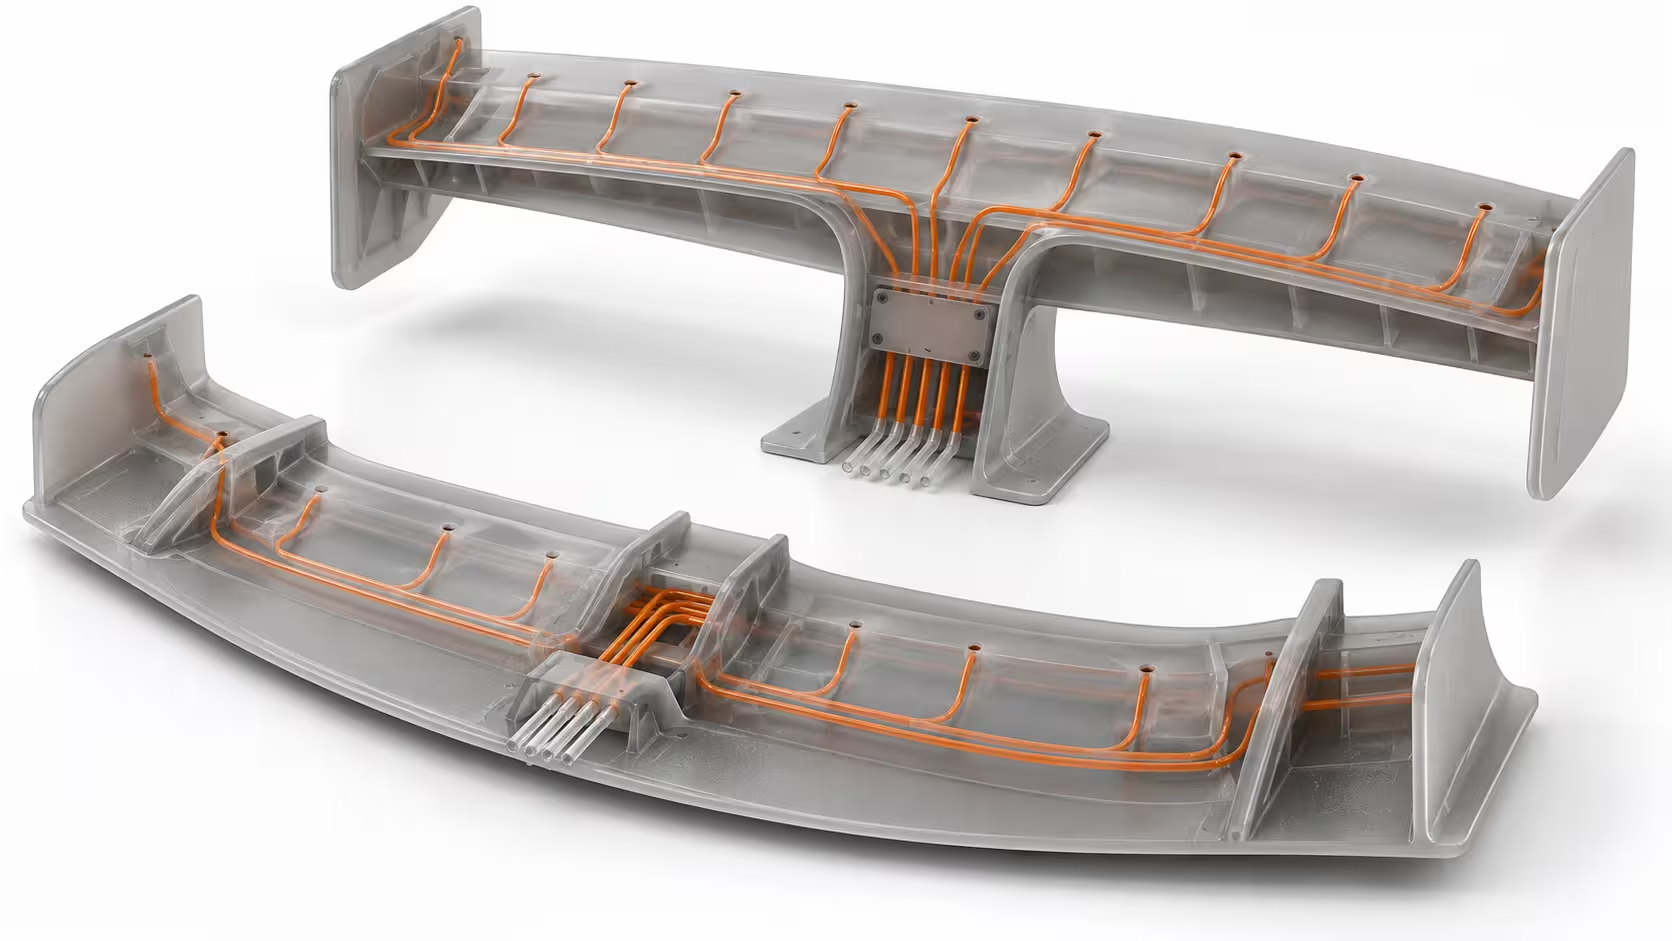
Yes, industrial SLA can print 0.6 mm pressure–tap holes with channels routed inside the model. Printable is not the same as usable, so every channel gets cleared and flow tested before it ships.
The failure mode is uncured photopolymer sitting inside a long thin passage. It looks fine from the outside and reads nonsense at the scanner. We run each part through ultrasonic IPA solvent baths to dissolve that resin out of the micro–channels. Then we run a high–pressure pneumatic flow test with compressed–air syringe flushing to verify clearance before shipping. Hole quality matters too. A tap has to be perpendicular to the surface, free of burrs, and flush with the OML, because a raised or recessed tap reads the wrong pressure. Routing should avoid tight bends and end at tubing connections you can still reach once the model is mounted. Gulf Wind Technology reported printing internal structures and pressure taps that were difficult to make by conventional methods. Figure 3 shows a layout that keeps channels short and groups the tubing exits at a removable panel. A blocked tap found on the tunnel floor is a $990 hour spent with a syringe.
How do you prevent aeroelastic deflection on a scale-model splitter?
You prevent it by sizing thickness and reinforcement so that deflection at test dynamic pressure stays well below the feature size you are trying to measure. Geometry controls deflection at least as much as resin choice does.
What does cantilever math say about splitter thickness and dynamic pressure?
Tip deflection of a cantilevered splitter rises linearly with dynamic pressure and with the fourth power of overhang length, and it falls with the cube of thickness. That cube is the number to respect, because a thin shell loses stiffness far faster than it loses weight.
Treat the splitter overhang as a uniformly loaded cantilever plate of unit width. The load is the pressure coefficient times the dynamic pressure q, where q is half the air density times speed squared. Bending stiffness per unit width is the modulus E times thickness t cubed, divided by twelve. Putting those together gives a tip deflection equal to 3 times the pressure coefficient magnitude times q times overhang L to the fourth power, divided by 2 times E times t cubed. Tip slope is 2 times the load times L cubed, divided by E times t cubed.
Double the thickness and deflection drops by a factor of eight. Double the overhang and it rises sixteen times. A resin with twice the modulus only halves it, which is why wall strategy beats resin shopping.
Run it for a 1:5 splitter. At 40 m/s, q is 960 Pa. Take an overhang of 40 mm, a suction coefficient ofone, and a resin modulus of 2.5 GPa, which is typical for a rigid SLA resin. A 3 mm shell deflects about 55 microns at the tip and tilts about 0.1 degrees. Drop to 2 mm and deflection climbs to about 185 microns. At 1.5 mm it reaches about 440 microns with a tilt near 0.8 degrees. Same CAD, same resin, same tunnel speed. Ifride height at this scale is around 10 mm, that last case moves the gap you are trying to measure by roughly 4 percent. Real lips see peaked pressure distributions, so treat this uniform load as a floor and not a ceiling.
Speed hits just as hard, because q goes with speed squared. Raise a sweep from 40 to 50 m/s and the load climbs 56 percent, so deflection climbs 56 percent with it. The splitter bends most during the high–speed runs you booked the day for, and the downforce curve picks up a stiffness signature your CAD does not have. Published work agrees. A 2024 aeroelastic study found up to two degrees oferroneous twist in printed semispan wings, and a Formula Student test article failed at the higher oftwo test speeds. When a splitter gives up at hour six ofa $990 overtime block, the lost hours are not the worst part. The worst part is the data before the failure, which you now have to doubt.
How do SLA skins mate to CNC spars and sting mounts?
We mate SLA skins to CNC aluminum spars through geometric interlocking pockets printed into the part, bonded with high–shear structural epoxy such as 3M Scotch–Weld DP420. Primary sting–balance mounts take brass heat–set threaded inserts, so fastener pull–out never depends on bare resin.
We do not rely on butt joints, because a butt joint pushes the whole load through a thin bondline and peels from the edge. An interlocking pocket turns the load path into shear across a wide bonded area and locks the spar in position relative to the OML. The spar comes from our CNC milling service, where bending stiffness comes from aluminum‘s modulus near 70 GPa, close to thirty times that ofthe resin. In the cantilever equation
above, that is the difference between a lip that moves hundreds ofmicrons and one that holds still. Where an interface needs a metal datum beyond what inserts offer, DMLS metal mounts cover it. A hybrid is not a patch for a weak print. It is how a rigid test article gets designed, and Sauber describes the same metal spine under rapid–prototyped bodywork.
Agree a deflection target at your test dynamic pressure before the build starts, and the reinforcement gets sized against that number.
How does OML verification with a 1 to 3 day turnaround protect a booked tunnel slot?
Blue–light scan data shows the model matches the released CAD before it reaches the tunnel, and a 1 to 3 day build lets you plan against a fixed date. Together they protect paid occupancy and the run matrix.
What should a CAD-to-part inspection report show?
It should show a color–mapped deviation heat map against the nominal CAD, critical–section measurements, edge thickness values, and surface readings tied to the part revision. Anything less leaves you guessing about what you just bolted to the balance.
We use blue–light structured 3D scanning to the GOM ATOS standard and compare the scan to the nominal STEP file. The heat map shows OML variance across the splitter, floor, and wing elements, and we verify the OML to the micron level. Every report carries the part revision, so when you compare a baseline against a derivative you know process drift did not create the delta. Figure 1 shows the format. I have been burned by a model that looked perfect and measured wrong by a millimeter in the one region that mattered. A heat map finds that in minutes and the tunnel floor finds it at $990 an hour.
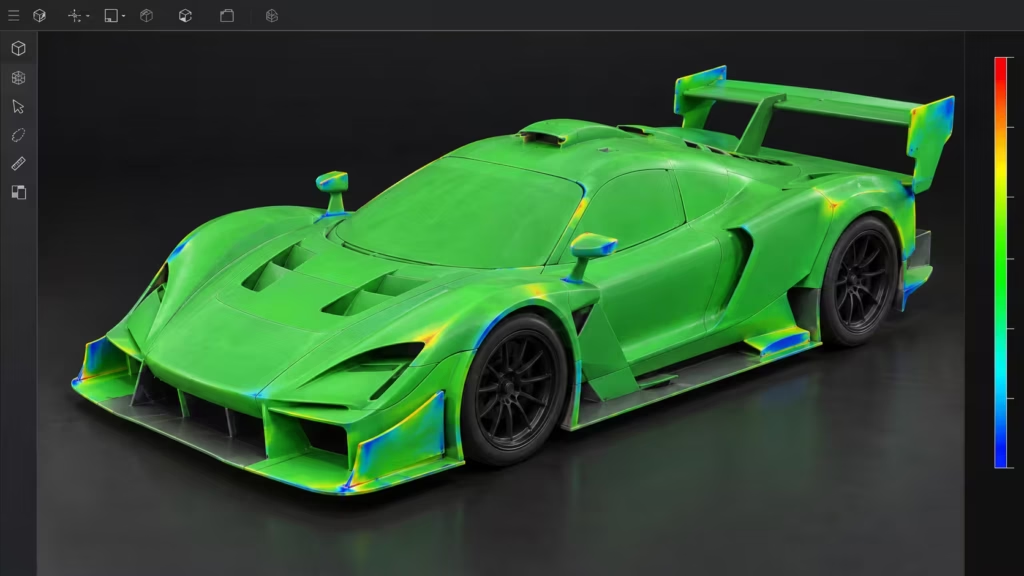
CAD-to-part inspection scan showing OML variance
What does a lost day cost at published tunnel rates?
At the University of Washington‘s Kirsten Wind Tunnel, weekday occupancy is $860 per hour with a nine–hour daily minimum, which is $7,740 before instrumentation, and overtime runs $990 per hour. North Carolina‘s A2 Wind Tunnel lists $595 per hour.
A2 reports 4 to 6 runs per hour, so every hour spent shimming a warped interface or chasing a blocked tap removes several configurations from the matrix. UW lists customer–controlled idle time at $4,600 per day, and A2 applies cancellation charges inside 14 days. These numbers explain why NASCAR‘s SLA strake program, which cut prototype cost by 50 percent and removed an average week from development, mattered to its engineers.
They also explain why Stewart–Haas Racing split its Mustang Dark Horse body panels across internal printing, Ford‘s additive center, and an outside service. Overflow is normal practice, even for teams with their own machines.
When your lab queue is full, we act as that overflow capacity. Confirmed machine allocation, a fast DFM response, and a defined recovery plan for a failed build mean the date you give us is the date we build against. See how this fits automotive programs from prototype through test.
How do I submit CAD for a DFM review?
Send your CAD files to 3D Vector for an engineering review before you commit a build.
Turnaround from approved CAD is 1 to 3 days.
To review quickly we need the model scale and bounding box, target tunnel date, test speed or dynamic pressure, whether the model is rigid or aeroelastic by intent, sensitive surfaces, target Ra and Rz, OML tolerance, minimum edge thickness, pressure–tap count and diameter, insert requirements, and ship–to deadline. We flag support placement, split lines, and stiffness risks before anything prints, so you do not discover them on a $990 hour. Start from our industrial SLA service page or call 416-477-3525. You can also reach us at 3D Vector, 1455 Britannia Rd E #8, Mississauga, ON.